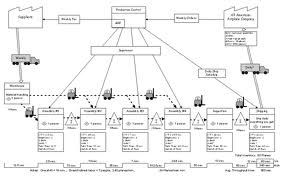
As the next step in our lean journey, we held a value stream mapping meeting last week. Value stream mapping is a way to visually see how you are delivering value to your customer. In our particular case, we were mapping our entire process from pre-bid to close-out. This was a very high level strategic map intended to see where our best opportunities are to increase flow through the company. Value stream mapping can also be used at a low level where you examine a specific process.
One thing I love about lean is that it isn’t just process improvement. While many of the tools will help you improve your processes, the goal is to help you see waste in the whole operation. Many times, there is a huge amount of waste as things flow across the organization. In the handoff from sales to operations, or the handoff from engineering to the shop. Value stream mapping helps you see those types of issues.
This exercise also helps create good alignment between departments. We had our whole senior leadership team in the room. We mapped out our entire process together and we could see what really happens in each department. We were able to discuss openly the problems we face and see what impact each department has on the other.
We started with an exercise to really define what the customer wants from us. What do they want to pay for? What don’t they want to pay for? What value do we bring to them? This first step helps you get clear how your customer defines value so that you can focus on increasing the value and removing the waste.
The next step was to create a current state map. We rolled out a long piece of paper and laid out phases of our projects. We had 6 phases: pre-award, award, procurement, shop fabrication, field installation and close-out. We then created sticky notes for each main activity in that phase. Each sticky described the department that owned it, the name of the task, the lead time, the cycle time and the value added time along with any software that was used in that task. We mapped out all of our main tasks on the board and placed them approximately where they would go. If a process preceded another process, it would go on the same line, if the process happened concurrently, you would place it below the other tasks. We then calculated our actual overall durations for lead time, cycle time and value added time.
The main thing I learned from this is that the amount of time we spend on our process is huge compared to the amount of time that value is being created. You could also see visually how many activities were happening in some phases and how few were in others. A lot of the bottlenecks happen when you have a ton of things happening at the same time.
We next spent some time brainstorming on improvement ideas. We did a high level view for each phase of the project, and then we went through every single activity and explored opportunities to improve or remove it. We came up with some interesting ideas.
Our last step was to create a future state map that shows what our process would look like if we were able to implement all the ideas. This map is vastly different, removes a ton of waste and shortens virtually all of our lead times. This give us a target to look at and to work toward in our lean journey.
I think there are three main things that happened this week. We were able to see our entire organization and its activities all in one place. As a leadership group, we were able to gain alignment on what our customer values from us and what we want our future state to look like, and we were able to create a visual map of that future state. Our next step is to build a plan for execution and to create a way to communicate this vision to the rest of the company.
Stay tuned…